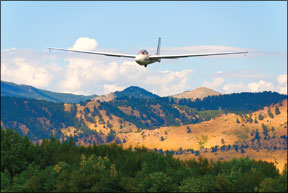
From almost our very first flying lesson, pilots are taught what to do in the event a single-engine airplanes lone powerplant fails. As with too many concepts at that early stage of our training, we basically accept what were taught without many questions. Later, as we gain experience, we begin to think more about those early lessons and try to apply to them what our experience has taught us. In turn, many 288 questions can arise. If your airplane ever becomes a glider, you would suddenly become very interested in its new aerodynamics. How promptly and accurately you can remember to make the most of the variables at your disposal would play a large part in determining where and how softly you land. Lets take a look at those variables and how they can affect your emergency glide. What To Do First Among the many potential challenges that might test ones airmanship and mettle when your single engine fails, one stands out above all: dealing with the fact that youre going downhill. Known to all pilots, from student pilot on up, flying at the “best glide speed” will give you the best chance of reaching the safest available area among whatever choices present themselves at that moment. In this situation, we like to think of the energy stored in our altitude above ground as our safety margin. If you picture this safety margin in the shape of an cone, we want to have the biggest “cone of safety” possible, given the altitude we have to work with. Of course the first, last and ongoing thing to always remember-and the thing about which we must continually remind ourselves-is to keep flying the airplane. Being familiar with the emergency procedure particular to the reason for your just having become a glider is part of that. There are, of course, two other and simultaneously immediate things you need to do. The first is to establish and maintain your airplanes best glide speed, presuming you 
Everyone agrees, however: The one thing you should definitely not be doing is fixating on the airspeed indicator to the exclusion of looking outside (A few furtive glances on the way down to check your chosen landing spot? Sure…). By holding attitude until best glide, the theory is that you therefore help avoid fixating on the airspeed indicator.
Regardless of how you get to your airplanes best glide speed, the second of those two things is to find somewhere to land (the odds for which are greatly improved if you always know where you are). In this discussion, were going to focus primarily on item one, glide speed.
Best Glide Speed?
In most general aviation airplanes, the attitude for best glide is close to that used for level flight. (However, immediately upon experiencing a loss of power, the nose would drop, so there would need to be a noticeably different trim setting.) The POHs best glide speed, often given only for the airplanes maximum gross weight, decreases by the
square root of that gross weight, but the correct attitude to maintain this speed remains unchanged. Also, the ratio of lift to total drag reaches a maximum at a certain angle of attack.There are several useful and well-known kinds of performance curves out there in “Theoryland.” Among the first to which were introduced is the one depicting the steady rise of a dimensionless number called the coefficient of lift with increasing angle of attack, increasing at somewhere around 0.1 per degree up to anywhere between 1.0 and 1.8, and leveling off at this thing called CLmax, represented as the top-most point of the red line in the chart at right labeled “Lift vs. Angle Of Attack,” soon after which point the wings stall if this “critical” angle of attack is exceeded. For a given airfoil, this happens at the same angle-usually between 16 and 18 degrees-regardless of the airplanes weight, pitch or bank, although the stall speed itself doesnt stay the same.
Then comes the graph labeled “Speed vs. Drag,” above right, summing up how increasing speed brings increasing parasite drag and decreasing induced drag, resulting in a happy minimum of both total drag and required thrust, which occurs at the optimum lift-to-drag ratio, or L/Dmax. This value is represented in the graph as the bottom of the curve labeled “Total Drag.” Conveniently, this is the point at which we see both maximum range under power as well as the best power-off glide speed.
The maximum value of L/Dmax directly relates to the shallowest possible glide angle for a given airfoil, or glide ratio, often referred to as a Lift/Drag, or L/D ratio. For the Wright Flyer, it was about 8.3; for a DC-3, about 14.7; for Concorde, only about eight. In the animal kingdom, for a tern its nearly 20; for a sparrow, its only about four. Note that L/Dmax is not achieved at or near the critical angle of attack, but well below it.
The next pretty picture weve all seen is another J-shaped plot, the one labeled “Power vs. Airspeed,” on page 5. This graph depicts power required as a function of true airspeed, where the curve goes steeply up to the right to the airplanes maximum level speed from some minimum value. To the left, it also rises-though less steeply and to not as high a value-to the airplanes minimum level-flight airspeed. This area to the left of the curves bottommost point is known as the region of “reversed command,” where it takes more power to fly more slowly.
Actually, from the minimum point on this curve, thanks to parasite drag, the required power goes up very steeply with increasing airspeed, not just by the square of velocity, but by its cube (e.g., to fly twice as fast, you need eight times the power).
The speed shown for the point tangent to a line extending from the origin tells us the maximum-range airspeed, and the airspeed corresponding to the minimum on this curve is the speed for maximum endurance. The minimum point on the drag curve represents maximum-range airspeed. The best rate of climb airspeed is very near this minimum also, and anything less than this-including the best angle of climb, Vx-flirts with the back side of this curve.
Incidentally, one interesting fact is that for any airplane, the speed for both a minimum sink glide, as well as minimum power required (i.e., maximum endurance), is almost exactly three-quarters of the speed for best glide, as well as maximum range. (Actually, its almost but not quite 0.76, or to be insufferably precise, the fourth root of one third!) Also, the best glide and max range speeds are in turn that same exact fraction of the “optimum cruise” speed (minimum fuel flow per knot), which is itself located at the tangent point of a line from the origin on the total drag curve!
Rules of Thumb
With this particular reference system, the origin effectively shifts left onto the negative X-axis for a tailwind and towards the right for a headwind. That makes sense, because in a tailwind, moving the origin away from the curve results in the tangent line touching it at a lesser speed; the opposite happens in a headwind.
In a similar way, the origin also moves up along the positive Y-axis for sinking air and down for rising air. By moving the origin up, again the tangent line occurs at a higher airspeed, which makes sense since youd want to get the heck out of there.
As a general rule of thumb, for most small airplanes, when against a headwind or a downdraft, you should increase glide speed by half the headwind component (and if you had a variometer, also by four to five knots per 100 fpm of sink). With a tailwind or updraft, decrease glide speed by one quarter of the tailwind component, or two to three knots per 100 fpm (but not to a point below minimum sink speed).
Although these algorithms are quite simple and repeatable for each particular aircraft, it didnt occur to anyone in the aviation community until about 1949, when the recently deceased Dr. Paul MacCready (then a student at Cal Tech) developed the idea of a rotating velocity bezel (or “speed ring”) for the variometer of a glider which tells the pilot at just what speeds to fly for optimizing the glide ratio through rising or sinking air.
Weight and Drags Effects
The curve itself stays put, unless the aircraft gains weight, in which case it is still tangent to the same line from the origin (i.e., the glide ratio remains unchanged) but now moves down and to the right, flattening out somewhat.
More precisely, as mentioned earlier, best glide speed decreases linearly with the square root of the weight.
One approximation for a small aircraft would be about 1.5 percent for each 100 lb. below gross weight; another is that the percent reduction in best glide speed is half of the percent reduction in weight.
Also, if drag increases, say by adding full flaps or by lowering the gear, both of which together can increase the drag three-fold, the effect is counterintuitively opposite to a headwind; one retains best glide airspeed only by reducing airspeed according to, as it happens, the fourth root of the increase in equivalent “flat plate area.”
In this case, the curve again moves, down and to the left (although the point of minimum controllable airspeed doesnt budge), which steepens the optimum glide slope and not surprisingly decreases the distance one may glide.
A real-world example would be when a Bonanzas landing gear is extended: Drag is about doubled. But since it is only affected according to the fourth root of drag area, your best glide speed would drop by about 16 percent. (This isnt catastrophic, but you never know when you might need it.) Altitude has no effect on glide performance, only upon the true airspeeds and rates of descent.


