Time for a pop quiz: What do these three accidents have in common? (Our descriptions omit the phrase “the pilot of” as redundant.)
1) A Piper PA-32R-300 Lance attempted to take off from a 3200-foot-long grass runway on a June morning with flaps retracted. It lifted off at the end of the runway, then descended into a shallow valley, touched down and lifted off a second time, before settling back to the ground and colliding with a barbed-wire fence. It was later determined to have been 188 pounds over its maximum gross weight with its center of gravity 0.15 inches aft of limits. Density altitude was about 1800 feet above field elevation.
2) A Cessna P210 Pressurized Centurion took off downwind from a mountain airport at a density altitude in excess of 7000 feet. The airplane broke ground about 3000 feet down the 4100-foot runway, immediately retracted its landing clear, and climbed about 75 feet before banking to the left and starting to descend. Just beyond the airport fence, it bounced off an asphalt road and crashed onto railroad tracks. Its weight was estimated to be within plus or minus 50 pounds of its rated maximum gross.
3) A Mooney M20J 201 with two passengers aboard tried to make an uphill intersection departure from a 2478-foot runway at night. It lifted off at the numbers on the departure end; the stall warning horn began sounding at once. The airplane banked left and descended into trees. Surface winds were described as “very light.” The pilot had not made any weight-and-balance calculations but had remarked that the airplane was “a little overweight” on the first leg of the trip. He’d passed up an airport with a 5000-foot runway 13 miles away to land “a few minutes closer” to their destination.
If your answer to our quiz is that all three involved high-performance, complex piston singles, you would be mistaken: the Mooney had a 200-hp engine. A guess that none of the accident pilots were deeply familiar with their aircraft would be getting warmer; the Piper pilot had 165 hours in type, the Cessna pilot 160. The Mooney pilot’s logbook wasn’t found, but his application for a commercial certificate filed less than a year earlier had listed 272 hours total.
Of course the real answer is the obvious one: None of these gentlemen had a clear understanding of either their airplanes’ capabilities or how to attain them. They’re not alone. Botched takeoffs are the second most common accident cause, and while some are purely stick-and-rudder lapses (e.g., runway excursions in crosswinds), more than half—including nearly three-quarters of those that prove fatal—arise from errors of planning or procedure.
When It Counts
There’s a reason most of us don’t calculate takeoff requirements, weight and balance, crosswind components or fuel requirements before absolutely every flight: Having previously done so for similar or less favorable conditions, we already know everything’s okay. If there was room to get off the runway with your two 250-pound cousins on board, departing solo shouldn’t present a problem.
It’s a perfectly reasonable shortcut provided you’re mindful of the unstated assumption of “other things being equal.” If the flight with your cousins used a 7000-foot runway with a brisk headwind on a frigid January morning, you can’t reliably presume the same performance on a solo flight from a short mountain strip in July.
Bush pilots learn how to gauge aircraft performance against takeoff and landing distances by eyeball, with lots of practice and occasional—sometimes disastrous—miscalculations. Most aircraft owners, however, tend to fly in and out of the same fields under similar circumstances. This puts a premium on those of us who aren’t delivering freight to the back country to recognize when the situation’s diverged from the familiar. That in turn argues for a little of what the quantitative types call “sensitivity analysis”—estimating how seriously changes in those conditions affect the ultimate results. In our case, the choices about aircraft loading, time of departure and the eventual go/no-go decision are what makes the difference between a successful takeoff with adequate climb rates or a subsequent phone call to our insurance agent.
Spend a little time with your POH’s performance tables (or graphs—we prefer tables for reasons explained in the “Takeoff Performance By The Book” sidebar on page 18, but you’re stuck with what the manufacturer chose). If a 3000-foot runway is unexciting when taking off solo with light luggage, what would it be like at max gross? Now add three or four thousand extra feet of density altitude. Maybe five knots of tailwind to take off away from the hills? The idea isn’t to nail down every possible combination of factors ahead of time, but to build a sense of when familiar rules of thumb can no longer be trusted. With that in mind, err on the side of caution and run the numbers any time it’s even close.
And once those numbers are in hand, don’t trust them, either (see sidebar above). Assume you’ll use more distance breaking ground and climb more slowly than the POH seems to promise. Why? Well, first off because you probably will, but also because having runway left over always beats finding out that you didn’t have enough.
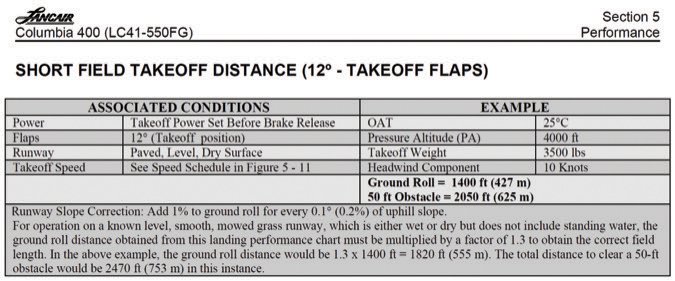
Using ‘The Book’
The performance figures in your airplane’s POH are another of aviation’s takes on “Heads I win, tails you lose.” Maximizing performance—especially takeoff performance—requires precise adherence to book procedures. But even with perfect execution, you can’t expect book results.
Both facts are consequences of manufacturers’ flight-test procedures as leavened by marketing pressure. The numbers arise from multiple trials by factory test pilots flying new airplanes, perfectly rigged, with fresh engines. They get repeated chances to perfect their technique, and missing the laser beam by six inches satisfies the 50-foot clearance test. Better numbers are presumably better for sales, which is to say that when the POH cites 1850 feet to clear that 50-foot obstacle, it means that despite all their advantages, the factory pilots couldn’t consistently do it in less. Most of us, on the other hand, can’t do that at all.
Other caveats also apply. The adjustments for wind conditions (“add 10 percent for each 2.5 knots of tailwind”) and soft surfaces (who knows how soft?) are usually rules of thumb, not actual test results. Add appropriate fudge factors. And aircraft configuration is key. If the chart or table specifies “short-field technique” or even “25 degrees flaps,” better use that—otherwise, all bets are off.
Try It Out
Now it’s time to become a test pilot. Not only is it prudent to learn just how much actual performance differs from POH numbers, but it’s a good idea to perfect your technique under more forgiving circumstances. We’d recommend using a comfortably long runway and recruiting a friend to count stripes while you focus on extracting the best climb your aircraft can muster. Write down the conditions—field elevation, runway used, temperature, wind speed and gross weight—and record the distances.
Start by making sure you’re configuring the airplane correctly. Constant-speed props should be set for maximum rpm, but what about flaps? That’s specific to the model. In our examples, the Lance wanted 25 degrees, the Mooney 15 and the Cessna 10. Any other choices will produce longer ground rolls and slower climbs. The timing and sequence of configuration changes likewise is model-specific. Retractable Cessna singles call for leaving the gear down until all obstructions have been cleared; not only is drag greatest while the gear is in transit, but during the mains’ pivot aft they actually reach further down than when locked, slightly increasing the risk of snagging the treetops. Low-wing retractables, on the other hand, may benefit from raising the gear as soon as the airplane’s attained an unmistakably positive rate of climb—but is it better to retract gear before flaps, or vice versa? If the manufacturer didn’t specify, try it both ways and see.
Once you’ve got the procedure figured out, fine-tune your airspeed control. You need to hold VX precisely until you’ve cleared any obstructions, then make a smooth transition to VY without overaccelerating or losing airspeed—exactly as stated in the test standards. (Maybe that’s the reason they put it in there.) Only when your technique is sharp will you be able to get a realistic sense of the lower bounds of the airplane’s runway requirements.
Running through this exercise several times in different combinations of aircraft weight, elevation, density altitude and wind conditions will provide a comprehensive picture not just of how much of a safety margin to add to the book figures, but of whether it needs to be further increased in particular situations. Does higher density altitude require more of a buffer than greater weight? That’s a good thing to know.
We Were Told There Would Be No Math
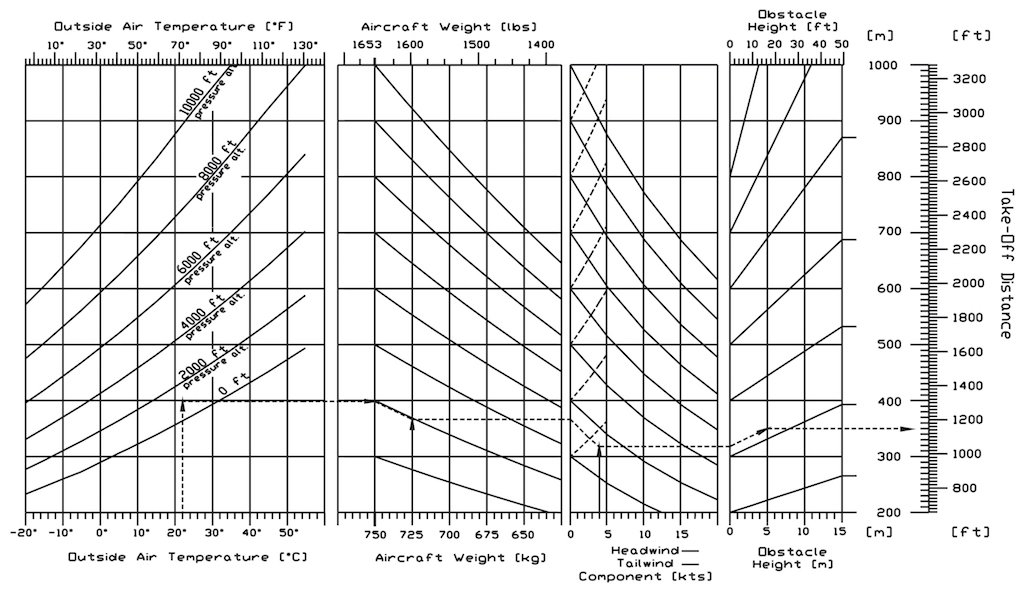
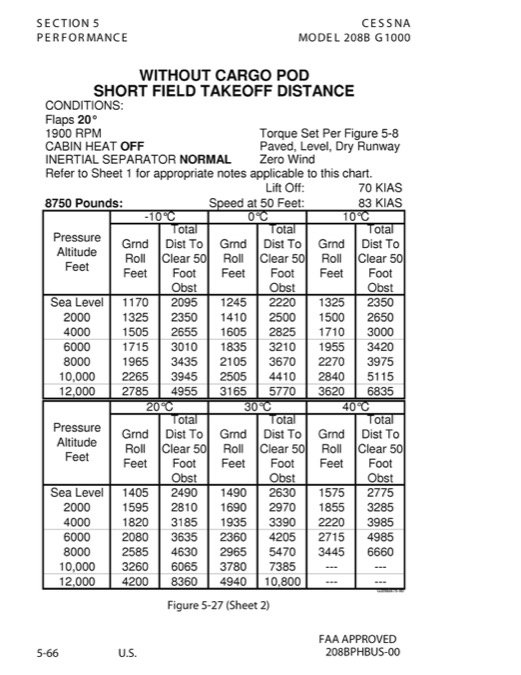
Cognitive scientists and practical statisticians have long recognized the gulf between people who prefer seeing quantities pictured in graphs and those who find it easier to interpret tables of numbers.
When predicting aircraft performance, the tabular format is clearer, more straightforward, and easier to get right—provided you can do some simple arithmetic.
The takeoff performance chart, an example of which for the Diamond DA20 is at lower left, requires the pilot to move from outside air temperature and elevation on the left to gross weight and wind speed in the center and to adjustments for head- or tailwind components.
The results are pushed further sideways to a fourth panel representing obstacle height. It’s complicated and error-prone, even if you’re handy with a straightedge and a sharp pencil.
Tables, on the other hand, box things in within a couple of cells, as demonstrated by the excerpt from a Cessna 208B Grand Caravan takeoff performance table at bottom right.
Given numbers for 2200 and 2300 pounds and density altitudes of 3000 and 4000 feet, a pilot operating an airplane weighing 2250 lbs in 3500-foot density altitude conditions can split the difference twice—or conservatively use the least favorable case in one or both dimensions.
Adding or subtracting a few percent for winds is easily done mentally after appropriate rounding away from optimism.
| Cessna 206 Performance on Wipline Amphibious Floats | ||
| Model | 206H | T206H |
| Engine | IO-540 (300 hp) | TIO-540 (310 hp) |
| Takeoff run (land) | 1146 feet | 1132 feet |
| Takeoff run (50-foot obstacle) | 1830 feet | 1876 feet |
| Takeoff run (water) | 1770 feet | 1821 feet |
| Takeoff run (water, 50-foot obstacle) | 2850 feet | 2954 feet |
| Rate of climb (fpm) | 770 | 982 |
What If There’s No Book?
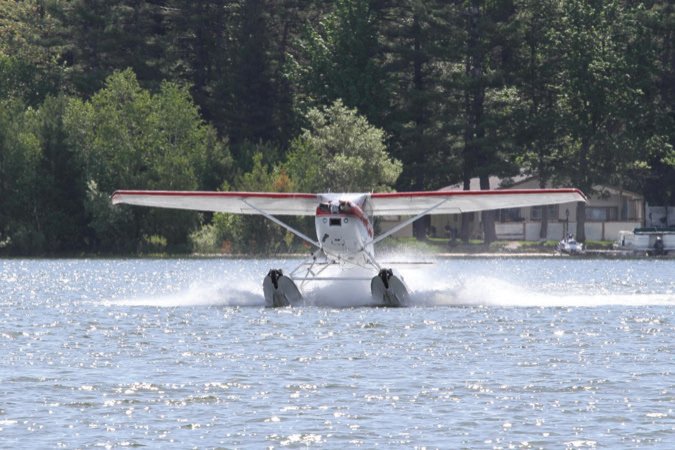
Older POHs and those for airplanes that have been significantly modified may not have an approved supplement reflecting the changes or real conditions. A great example is a landplane modified with floats.
Above, we’ve reproduced some data from float manufacturer Wipline showing the before-and-after difference of adding amphibious floats to a Cessna 206 Stationair. (We presume Wipline’s data is for a sea-level airplane at gross weight.) The hydrodynamic drag adds more than 1000 feet to the distance required to clear a 50-foot obstacle for both versions of the 206 according to Wipline. Besides floats, other modifications like tip tanks can include a gross weight increase. One solution may be extrapolation, but that can get messy when the original POH isn’t accommodating.
On Your Own
There are three cases where manufacturers’ performance figures are especially unhelpful. For amateur-built aircraft, of course, they simply don’t exist. Guidance from designers or kit makers is simply that; actual performance depends on individual design choices and quality of construction. It’s up to the builder and/or test pilot to conduct meaningful trials that fill in those non-existent numbers.
The manuals provided for airplanes before the 1978 industry-wide POH standardization may provide little or no performance data—perhaps a single graph of takeoff distance from “a paved dry runway” against density altitude at maximum gross weight, with no information on how to adjust for soft or wet surfaces, headwinds, tailwinds, etc. These are best used to establish a baseline for how long a runway is required to conduct your own flight tests safely.
And aftermarket modifications that alter aerodynamic characteristics—vortex generators, speed mods such as flap gap seals, or both—can not only affect takeoff and climb performance, but even change critical airspeeds from those published. Moreover, multiple aerodynamic STCs may interact in unpredictable ways, particularly if they come from different vendors. A fatal spin in a Beech Baron was linked to a pair of STCs, one of which reduced its minimum controllable single-engine airspeed while the other increased it. There is no evidence the pair of modifications had ever been tested together. See the sidebar on this page for another example.
It’s the Airspeed, Stupid
We’d be remiss if we wrapped up this discussion without a reminder of the illusion that can trap pilots departing from elevations significantly higher than they’re used to. (We’ll assume the engine has been leaned for best power rather than left at full rich, another characteristic gotcha.) Recall that in thinner air, greater airspeed is needed to produce comparable lift—but the true airspeed corresponding to any indicated airspeed is also higher. This has the convenient result that the same indicated airspeeds work—for rotation and climb, and also approach and landing—regardless of field elevation. However, the higher groundspeeds and shallower angles that result “look wrong” to pilots from lower localities, leading some to pitch up in an instinctive effort to regain a more familiar sight picture. If the result isn’t a stall, it’s at best significantly degraded performance when there may be no performance left to lose.
David Jack Kenny has been a statistician twice as long as he’s been a pilot, but enjoys flying more than twice as much as analyzing data. He’s a fixed-wing ATP with commercial privileges for helicopters.



Great article. I’m a new airplane owner, and the above exercise recommendations couldn’t be more timely.
Great article. I fly a Commanche 250 and have about 1500 hours in it. The performance has been all over the charts with all the different flying conditions that I have found myself in and fortunately have been able to work within the limits of the planes abilities even though it has been pushed a couple of times. Experience drives better decisions but always err on the side of caution
All these accidents should be attributed to poor risk management. If we use the rsik management lens as a filter (i.e. using techniques such as PAVE, a risk assessment matrix, and TEAM) we can prevent most fatal accidents. In this case, the “environment” or “V” category of hazards and associated risk came into play
Actually the Mooney M20J 201 is considered high performance and complex.