At one time or another, we’ve all passed an FAA knowledge test requiring us to calculate aircraft performance for various phases of flight, such as takeoff, cruise and landing. Even though we’ve been trained and tested on our ability to interpolate the answer down to the foot, mile, minute or gallon, these calculations alone don’t ensure we’re always operating the aircraft prudently. For one thing, they don’t account for poor technique, worn equipment or errors.
Effective risk management requires us to go further and build in what some might call a fudge factor, something that, for example, helps us compensate for less-than-perfect technique. We can do that in various ways, including regular training and practicing maximum-performance takeoffs and landings, carrying more fuel, opting for the longest runway available and avoiding non-cooperative weather. Whether we realize it or not, we establish safety margins, allowing us to err in performing the maneuver or its calculations yet still complete the operation. I call them performance margins.
Performance Matters
We spend a lot of our initial and recurrent training time on maneuver-based skills related to takeoffs and landings, but this training seldom emphasizes the importance of performance calculations or of the need to create additional safety margins beyond the calculated performance. The truth is that the safe execution of such routine maneuvers as takeoffs, climbs, cruise and landings is as much determined by advance performance analysis and risk management as it is by physical stick and rudder skills.
For example, presume a pilot operating a 1977 Cessna 172N Skyhawk normally flies from a paved, sea-level runway 2000 feet long. He normally flies alone and, at his reduced gross weight of 1900 pounds, he can take off and clear a 50-foot obstacle in a little less than 1000 feet when the temperature is 50 degrees F, per the Skyhawk’s Pilot’s Operating Handbook (POH).
Now picture this person flying to a 2800-foot grass runway at an elevation of 5000 feet msl to pick up two 200-pound friends on an 86-degree F day. Recognizing he will be taking off at full gross weight of 2300 pounds (assuming he tops the tanks), he may even consult the POH and, reading the main table, concludes that his takeoff distance over the obstacle will be 2595 feet. Just enough, he thinks. However, he fails to notice footnote 4 to that table, which says to add 15 percent to the ground roll distance for operation on a dry, grass runway. His “calculated” takeoff distance over the obstacle is now 2810 feet. However, it rained the night before and the grass runway is still wet and a little soft. Not only that, but the pilot forgets to lean the mixture for the high density altitude conditions.
Will this pilot fail to clear the obstacle, lose control trying to avoid it or collide with it because of a delayed abort? Will he stall just as he barely clears the obstacle? It’s highly likely that one of these things will happen. The resulting accident might be labeled as resulting from a loss of control or stall accident, but the real root cause would be much more complicated.
The great majority of accidents, both fatal and non-fatal, are pilot-related. Takeoffs, landings and fuel-related accidents are the top three categories, as summarized in the chart at top right, excerpted from the AOPA Air Safety Institute’s 25th Joseph T. Nall Report, which examined accidents in 2013.
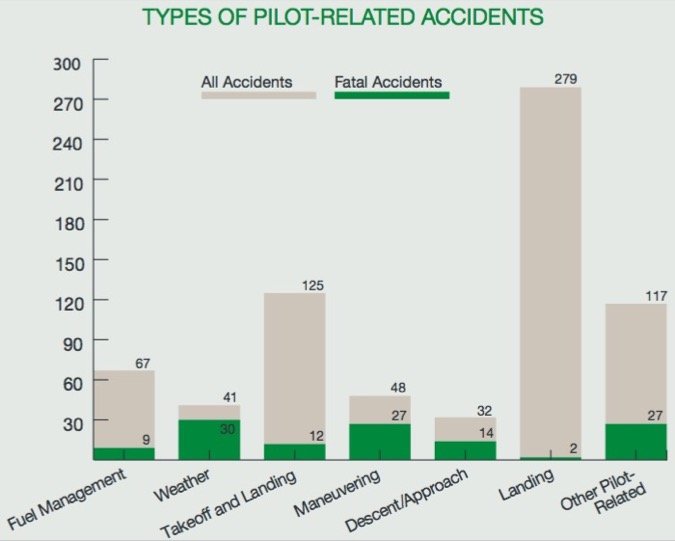
Fortunately, few of these accidents are fatal, when compared to other types. Additionally, not all of them result from inadequate performance calculations or failing to manage the risks of these flight phases. However, as we look at each of these phases of flight, we can see from accident reports that pilots do not routinely make performance calculations, let alone add a safety factor or analyze the risks associated with marginal performance.
The importance of advanced planning and risk management to the successful outcome of any flight cannot be overemphasized. This is true even for simple flights, yet the data suggest pilots often ignore environmental and other factors affecting takeoff performance.
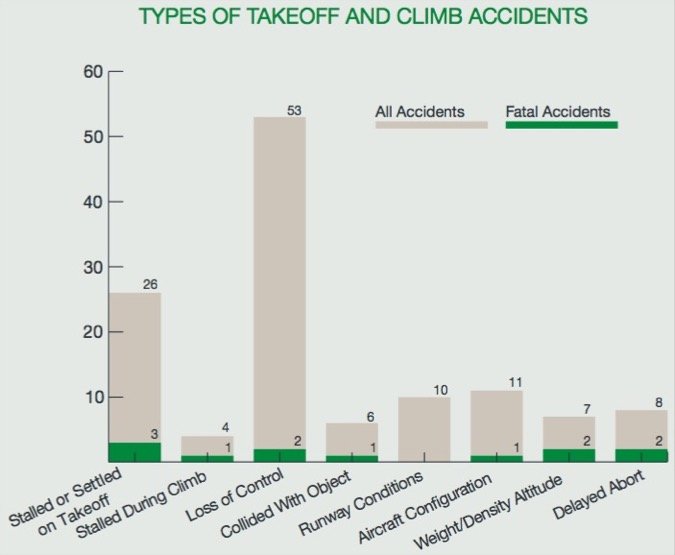
The graph at bottom right, also from the 25th Nall Report, suggests failing to recognize and account for the various factors affecting takeoff performance and the risks they pose may be a root cause of many takeoff accidents. The categories “stalled during climb,” “loss of control,” “collided with object,” “runway conditions” and “weight/density altitude” provide evidence for the need to account for environmental and aircraft-related risks associated with aircraft performance limitations.
We’re Not In Kansas Anymore
So far, we’ve talked only about takeoff performance, not what happens next. No matter how challenging the takeoff conditions, we still need to ensure we can clear terrain and obstacles during climb. Our perspective will vary—along with the performance margins we may want to establish—depending on the conditions and what we’re flying (terrain, day/night, IMC/VMC, single/multiengine).
It’s one thing to be flying a multiengine turbojet departing on a clear day from Salina, Kan., and quite another to be contemplating a night IMC departure from Jackson, Wyo., in the normally aspirated Cessna 310 I use as an example in the sidebar on page 6. This may be an extreme example, but consulting the departure procedures for KJAC and the Cessna 310 performance data is not encouraging.
The IMC departure procedures from JAC require robust climb rates, varying from 335 fpm to 450 fpm all the way up to either 14,000 or 15,000 feet. I compared the Cessna 310 performance at gross weight with the climb/descent table on the inside back cover of every U.S. terminal procedures publication and found that, at gross weight, the 310 actually would be okay climbing through 10,000 feet, but would run out of the required performance before reaching 14,000. The Cessna 310N owner’s manual didn’t have climb performance published for weights below max gross. My guess is that, with a reduced gross weight, the 310 could meet the departure procedure’s requirements.
However, think about the risks that likely ar present. You’re in IMC and headed for 15,000 feet. What about icing? What about an engine-out situation?
Although I picked a location that might be extreme, you will be faced with subtle climb performance issues at many locations, whether you’re in a twin or a single. Climb performance analysis should be part of your risk management sweep on any departure and especially so during IMC conditions.
Save Your Excursions For Vacation
As we saw from the first graph on page 5, the largest category of pilot-related accidents involves landings. Most of these fortunately are not fatal, but they do tend to bend a lot of metal (or composite material).
Accidents categories such as “loss of control,” “short landings,” “long landings” and “runway conditions” often result in runway “excursions” that have the aircraft leaving the runway and incurring damage. Avoiding these “excursions” is often a matter of flying the approach at the correct speed for aircraft weight and conditions. Many general aviation pilots fly their approaches too fast. They’ll often add a five-knot cushion, “just to be safe,” then tack on the crosswind’s advertised velocity, instead of halving it. The result often is using up twice as much runway as necessary on landing, even in stiff crosswinds. And—at least in our experience—the risk of losing control increases with touchdown speed. To obtain published performance, the speeds shown in the POH are the ones to fly.
As with takeoff performance, there is a big difference between Part 25 and Part 23-certified airplanes in terms of runway requirements. The margins built into Part 25 airplane performance tables don’t exist for Part 23 airplanes. Consider our Cessna 310N example one more time: The landing performance table shows the 310 can be landed over a 50-foot obstacle and stopped in less than 2000 feet under most conditions, assuming the approach is flown at the correct speed for landing weight. The problem usually happens when pilots just use the speed for the 5200-pound max gross weight for landing. Pretty much by definition, you never land at gross weight and after a flight of several hours, you will have burned off enough fuel to consider a slower target airspeed.
So there you are, landing at your favorite grass strip, thinking that its 3000 feet will let you to land with room to spare. You carry your normal 105 mph indicated speed for max gross rather than the 97 mph for your reduced landing weight of 4400 pounds. On final, you add an extra five mph for the slight crosswind.
Performance Minimums
You don’t have to add to your level of risk by operating under conditions which result in marginal performance. Consider taking the following simple steps to mitigate such risks while still accomplishing your “mission,” at least most of the time.
• Adhere to recommended speeds and procedures for all normal, abnormal and emergency operations.
• Be sure to account for unusual conditions and pay attention to the footnotes in performance tables.
• For routine operation, consider adding a performance margin to takeoff and landing distances. You don’t necessarily need to follow the Part 25/Part 121 requirements, but adding a 25 percent margin to all calculated takeoff and landing distances can help prevent mishaps.
• If operating a light twin, be sure to consider accelerate-stop and accelerate-go distances, and have a plan in mind for an abort before starting every takeoff roll. It’s better to have a “soft crash” rolling off the end of the runway than to be airborne and lose control below VMC.
• Remember to use standard risk management practices for analyzing all performance questions. That is, identify, assess and mitigate all risks before departure and while in flight.
Call it a fudge factor or erring on the side of caution. But plan for the worst case on runways and fuel.
Robert Wright is a former FAA executive and president of Wright Aviation Solutions LLC. He is also a 9700-hour ATP with four jet type ratings and holds a Flight Instructor Certificate. His opinions in this article do not necessarily represent those of clients or other organizations that he represents.
Think Your Light Twin Has You Covered? Think Again.
Transport category aircraft certified under FAR Part 25 must be operated under conditions “guaranteeing” the success of an engine-out takeoff: The aircraft must have the performance to safely continue the takeoff and climb even if the engine failure occurs after the aircraft reaches its decision speed (V1). Smaller twins certified under FAR Part 23 offer no such guarantees. In fact, under many conditions, their engine-out takeoff performance is so anemic that you are as bad off as being in a single.
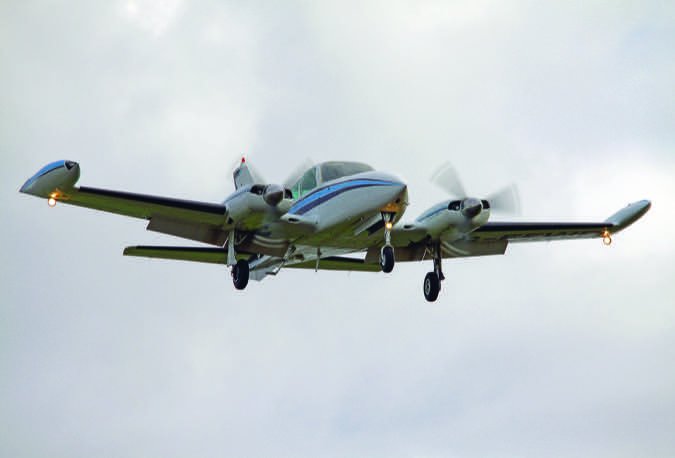
Most multiengine training emphasizes the engine-out emergency on takeoff. This training is essential, of course, but often fails to include proper performance planning and risk management.
As an illustration, I’ll use the Cessna 310N pilot’s operating handbook, which provides graphs for calculating normal takeoff, accelerate-stop and single-engine takeoff distances. The handbook assume a 3000-foot paved runway at an elevation of 2000 feet msl on an 80-degree F day with no wind. Our takeoff weight is 4800 pounds, 400 pounds below maximum gross takeoff weight.
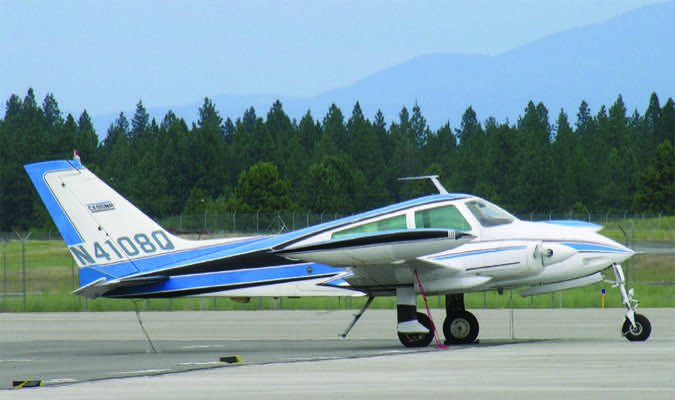
The calculated takeoff distance over the 50-foot obstacle with both engines is 2410 feet. But let’s assume you suffer an engine failure at the recommended takeoff speed of 101 mph. Consulting the graph for accelerate-stop distance, we find that 3525 feet is required to stop, more than 500 feet we don’t have. But continuing the takeoff is an even worse idea. The airplane’s single-engine takeoff distance would be 3830 feet.
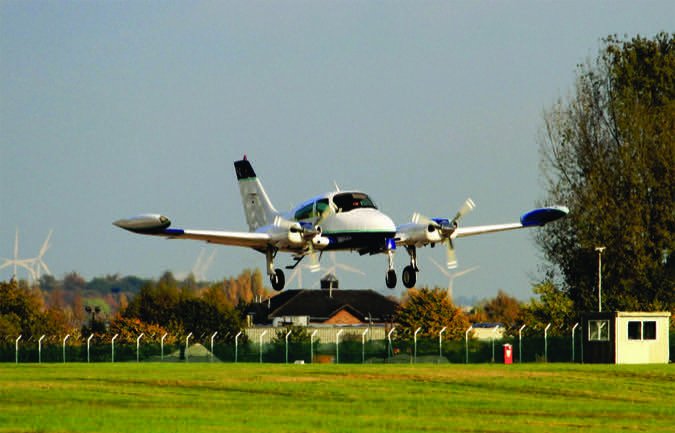
The bottom line here is that, if I operated a Cessna 310 or a similar twin on a regular basis, I’d want a runway a lot longer than 3000 feet. To manage the consequences of an engine failure during the critical part of a takeoff, 4000 feet would be my new absolute minimum, and I really wouldn’t “relax” unless the end of the runway was at least 5000 feet away.
Robert Wright is a former FAA executive and president of Wright Aviation Solutions LLC. He is also a 9700-hour ATP with four jet type ratings and holds a Flight Instructor Certificate. His opinions in this article do not necessarily represent those of clients or other organizations that he represents.


